
Most slow internet problems aren't about your plan speed, they're about one device quietly consuming everything while the rest of your network struggles. For IT managers and network admins dealing with a shared environment, that distinction matters a lot: the fix isn't a faster connection, it's finding which device is using the most bandwidth and doing something about it. This guide covers every method that actually works, from individual machines to your router dashboard to purpose-built monitoring tools.
Check Bandwidth Usage on Windows with Task Manager
Start by pressing Ctrl + Shift + Esc to open Task Manager. From there, the detail you want isn't on the default tab. Click Performance, then hit Open Resource Monitor at the bottom, and navigate to the Network tab. That's where you'll see every active process alongside its live send and receive rates.
Sort by Receive to find what's pulling the most data in.
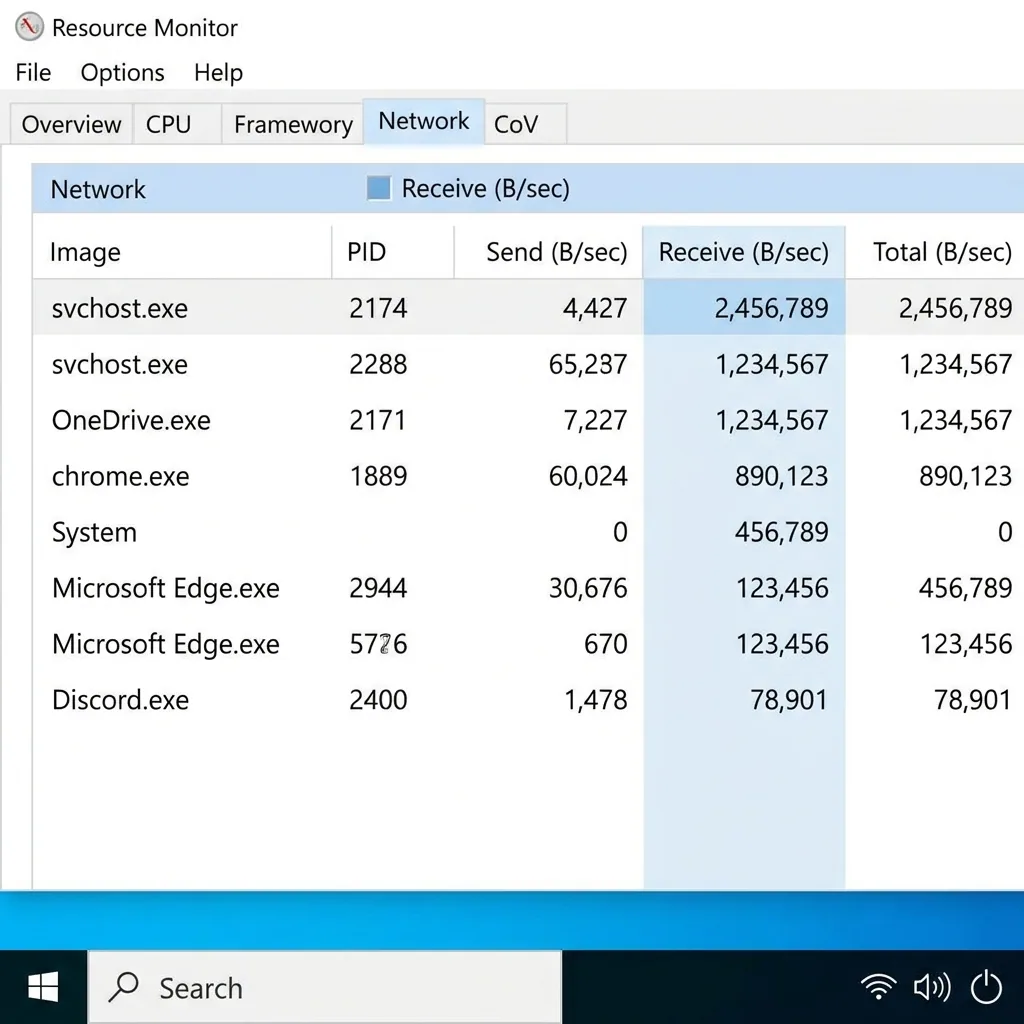
Background update services, cloud sync tools, and streaming apps are usually at the top. This view only covers the machine you're sitting at, but it's a useful first filter before you look at the full network.
Watch out for: Windows Update is one of the most common silent bandwidth drains. It runs in the background and doesn't announce itself, so if you see "svchost.exe" near the top of the list, that's often the culprit.
Check Bandwidth Usage on Mac with Activity Monitor
Open Activity Monitor from Applications > Utilities, then click the Network tab. You'll see bytes sent and received per process, sortable by either column.
One thing people miss here: Activity Monitor only shows what's happening on that Mac. It's easy to spend ten minutes investigating a single machine, conclude nothing's wrong, and walk away without ever checking the router. If the Mac looks clean, that's not the end of the investigation, it just means the bandwidth hog is somewhere else on the network.
Find Which Device Is Using the Most Bandwidth Through Your Router Dashboard
Your router is the only place that sees every device at once, which makes it the most useful tool for this. The navigation varies by brand, but the data is the same: a live or historical table showing upload and download rates per connected device.
ASUS Routers
Log in at 192.168.1.1, find Traffic Analyzer in the left sidebar, and enable it if it's off. It needs a few minutes to collect data before the charts populate.
Netgear Routers
Go to 192.168.1.1 and navigate to Advanced > Advanced Setup > Traffic Meter. Some models also show per-device activity under Attached Devices with a real-time column.
TP-Link Routers
Log in at 192.168.0.1, open the Advanced tab, and look for Traffic Monitor or Network Statistics depending on your firmware version.
Linksys Routers
Access the dashboard at 192.168.1.1, go to Troubleshooting > Diagnostics, and use the Bandwidth section. Linksys Smart Wi-Fi account holders can also check this remotely from a browser.
If your router's dashboard doesn't show per-device bandwidth at all, check whether a firmware update added that feature. A lot of older dashboards gained real-time monitoring in updates that many admins never applied.
In shared office environments, the router dashboard is often where it becomes obvious that the problem isn't a server or a core business application. It's a personal device running a video sync or a backup to consumer cloud storage during business hours, the kind of thing that generates helpdesk tickets for weeks before anyone thinks to look at the device list.
Monitor Bandwidth on Mesh Network Routers
Mesh systems handle this through a mobile app rather than a browser dashboard. Google Nest shows connected devices in the Home app, but detailed per-device bandwidth data requires a Google One subscription. Eero follows the same pattern, you can see which devices are active, but actual usage numbers are behind the Eero Plus paywall. TP-Link Deco is the most useful at the free tier, with a Network Statistics section in the Deco app that shows real-time and historical bandwidth per device without any subscription.
The underlying limitation across all mesh systems is that free tiers tell you that a device is active, not how much it's consuming. If that level of detail matters for your environment, Deco is the practical choice.
Use a Third-Party App for Deeper Bandwidth Monitoring
If your router's built-in tools are thin, GlassWire (Windows and Android) is the clearest option for individual devices. It gives you a visual breakdown of which apps are using bandwidth, with alerts when something spikes unexpectedly. The free version handles per-app monitoring on a single device; the paid tier extends visibility across the network.
For environments where you need per-device control across an entire subnet, not just visibility, tools like Perimetery PRO fill a gap that router dashboards and GlassWire don't. It runs as a desktop application on Windows or Linux, scans the network automatically, and shows live upload and download rates per device without requiring any agent installation on the devices being monitored. That matters in shared office environments where deploying agents across dozens of mixed BYOD and company devices isn't realistic.
Limit Bandwidth for the Culprit Device Using QoS Settings
Once you've identified the device using the most bandwidth, you can cap it.
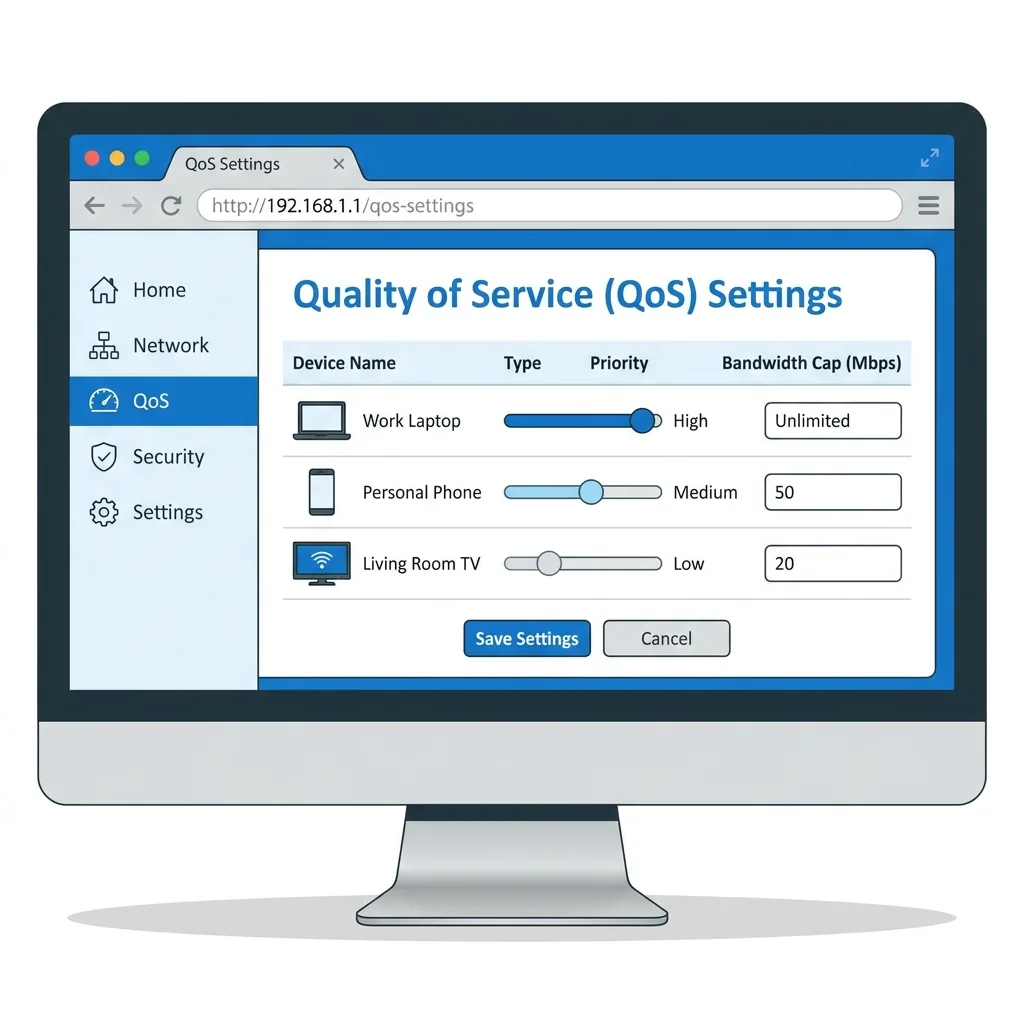
Most modern routers support Quality of Service (QoS) settings, which let you either limit a specific device's throughput or deprioritize it relative to everything else. On ASUS routers, look for Adaptive QoS in the main menu. TP-Link puts it under Advanced > QoS, and Netgear handles it through Dynamic QoS under Advanced Setup.
Set the offending device to a lower priority or assign it a hard bandwidth ceiling. Streaming devices, personal laptops running cloud backups, and anything doing large file transfers during business hours are where this breaks down most often in shared environments.
One thing worth flagging: QoS settings are frequently wiped after a router firmware update. If you configure limits and they stop working a few weeks later, that's almost always why. Check your settings after any update and reapply them. Router-level QoS also ties policies to IP addresses by default, which means a device that gets a new IP, through DHCP reassignment or a restart, can slip out from under the policy entirely. Tools that enforce limits by MAC address, like Perimetery PRO, avoid that problem by keeping policies attached to the device itself rather than its current address.
In short: Start with Task Manager or Activity Monitor to check a single device, then move to your router dashboard to compare usage across the whole network, and use QoS or a dedicated monitoring tool to cap whatever's causing the problem.
Once you've identified and capped the device using the most bandwidth, the most reliable trigger for running this check again is adding new devices to the network or fielding a sudden uptick in slowness complaints. Either event almost always signals a new bandwidth pattern worth investigating before it becomes a pattern of helpdesk tickets.
Frequently asked questions


See every device on your network
Perimetery PRO shows live upload and download per device, and lets you cap or block any of them in one click. Runs on one Windows machine, no agents to deploy.
See pricing